
Richard Hooper is Professor of Medical Statistics in the Centre for Evaluation & Methods, Wolfson Institute of Population Health at QMUL, where he leads the Methodology Research Unit and is a former Director of the Pragmatic Clinical Trials Unit.

Delivering an inaugural lecture is like having your life flash by in front of your eyes, but in a good way. Sometimes it helps to reflect on the twists and turns that make everyone’s journey different. The mathematician and cognitive scientist, Douglas Hofstadter (author of Gödel, Escher, Bach: an Eternal Golden Braid), wrote how “the self, such as it is, arises solely because of a special type of swirly, tangled pattern among the meaningless symbols.” – a crude but effective way of describing my own rambling academic career, spanning maths and health research.
My first experience of University life was sitting at home, as a child, watching Open University (OU) programmes on TV. In the 1970s there was very little on TV at all, at least in the daytime, and the Open University took advantage of this by broadcasting lectures on the BBC on a huge variety of subjects. There was food for the hungry mind there if you know where to look for it. Open University TV programmes certainly helped me to grow up without developing a phobia for maths, but this was not the limit of their content. A particular favourite of mine was the OU module on Modern Art & Modernism, and I also remember a fascinating OU series on the making of the James Bond film The Spy Who Loved Me.
School was never going to quite match up. I vividly remember my first art lesson at the grammar school I attended in High Wycombe. The teacher went round the class asking each of us in turn to give him the definition of a “pattern”. Over the best part of an hour we collectively fumbled our way towards the definition that the teacher wanted us to give, which was that “a pattern is a repetition of the same or similar shape”. Having been “taught” this, we each had to repeat the definition in turn to show our understanding. It was probably the worst school lesson in any subject that I ever had, and for whatever reasons I found my academic interests drifting during my secondary school years from the visual arts to maths and computing.
The school encouraged Oxbridge entry (Oxford or Cambridge), and in the Sixth Form I joined a group who were coached on taking the Cambridge entrance examination (in my case to study maths) – something like the History Boys but with numbers. We would practice answering seemingly impossible questions against the clock: “If you pour yourself a glass of water today, how many molecules of water in it could you expect to have been found in the fatal cup of hemlock that Socrates drank?” It taught us to memorise useful pieces of information like the diameter of the Earth, but it also taught us not be afraid of diving into a problem.
Cambridge in the 1980s was an inspirational place to study. It had history (our lectures were held just over the road from the Eagle pub, where Watson and Crick had celebrated the discovery of the structure of DNA) combined with present-day impact (Stephen Hawking ruled the streets of Cambridge, and the corridors of the Department of Applied Maths & Theoretical Physics). I took some classes in relativity and quantum mechanics – just because I could – but I knew I was never going to be a theoretical physicist, and I also knew that what was known as “pure” maths was not necessarily my thing either.

But if you went down a side street behind the Department of Pure Mathematics, you came to a side door, and screwed to the wall next to the door was a plaque that read, rather magically, “Statistical Laboratory”. And if you pushed on that door one day when it was unlocked, and went up a little flight of steps, you came to some pigeonholes, and on a shelf under these you found a stack of printed slips of paper (which I suppose passed for flyers in those days), and printed on those slips of paper were the following words:
If you have a problem involving randomness you need to speak to an expert.
Right then, I knew I had found my tribe. The annual Stats Lab photos, compiled across the decades, show the changing faces and fashions of statisticians at Cambridge. I used to think that the 1958 gang looked charmingly old-fashioned, but there I am in the 1988 photo (fourth from the left in the top row) frozen in my own time capsule of patterned knitwear.
I left the Statistical Laboratory in 1989 with a Postgraduate Diploma in Mathematical Statistics. I did not have much of a plan, and gratefully took up a job offer with the Department of Psychiatry at Cambridge. The role was based at the Winnicott Research Unit, named after the paediatrician and psychoanalyst, Donald Winnicott. Much of the research there centred on mother-infant interactions, especially in the context of postnatal depression. I had studied some very mathematical ideas as an undergraduate and postgraduate, but this was my first experience of applying statistical methods to health research. I learned on the job what it meant to be an applied statistician – something that I have never stopped learning.
During this time in Cambridge I also began studying part-time (which is to say, in my spare time) for a PhD with the grand title “Minimax kernel classifiers for pattern recognition problems”. I felt I had a head start on pattern recognition problems since I knew of old what the definition of a pattern was! (In fact, “pattern recognition” was the term used in those days for what is now more familiarly known as “machine learning”.)
On being awarded my PhD in 1996 I moved to London to begin a new academic chapter, working first at King’s College London and later at Imperial, and building long-term collaborations with inspirational research leaders including Simon Wessely and Peter Burney. Here is a 2006 BMJ cover story, led by Simon, on mental health screening in soldiers who went on to serve in the Iraq war. With Peter, who was a respiratory epidemiologist, I worked on data from the European Community Respiratory Health Survey and the Burden of Obstructive Lung Disease (BOLD) Initiative.
Since moving to London I had also been going to various evening classes at Central St Martins and The City Lit, and in 1999 I decided that what I really wanted to do was to study part-time for an HND (Higher National Diploma) in Jewellery & Silversmithing Design at London Metropolitan University. (I told you I had a problem involving randomness.) Peter Burney was surprisingly supportive of my intention to give up work half-time. He told me much later that he was always full of admiration for people who had ambitions outside the department.
So began a wonderful period of my life when I learned more about how to look at the world and make things. Below is the design and realisation of one of my final-year jewellery pieces, which pattern-fiends will instantly recognise as a repetition of the same or similar shape.


In the mid-noughties, with money disappearing at an alarming rate from my bank account, and realising that my earning potential as an academic statistician was much greater, I took stock again, and with no regrets I returned to work at Imperial full-time. Once again, Peter could not have been a more supportive and understanding line-manager.
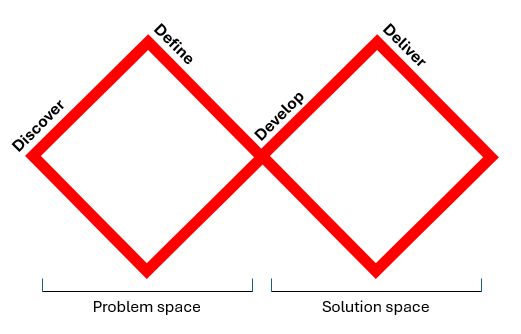
No opportunity to learn is ever wasted, and what I learned on my HND about the design process was generalisable to many other fields. The UK Design Council have produced a schematic called the Double Diamond, representing the process of design and innovation in any field (a nice validation of my previous comment). This is used by health researchers, among others, to think about the design of complex interventions or quality improvement programmes. The Double Diamond shows two phases of expansion and then focus, first in the “problem space” and then in the “solution space”.
At Imperial I began new collaborations, including work with my then-PhD-student, Ioannis Bakolis, on challenging the notion of “dietary patterns” that was central to the field of nutritional epidemiology at that time.
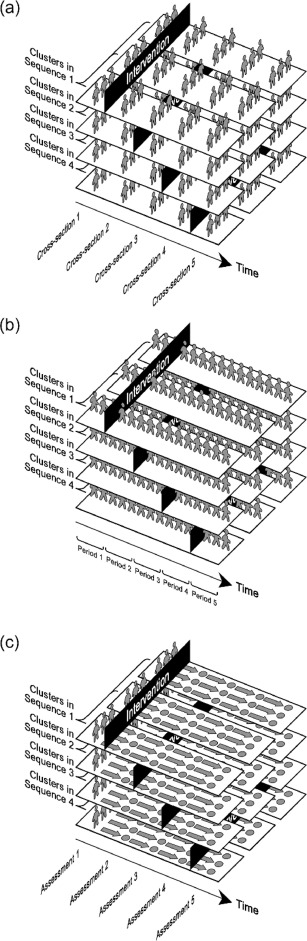
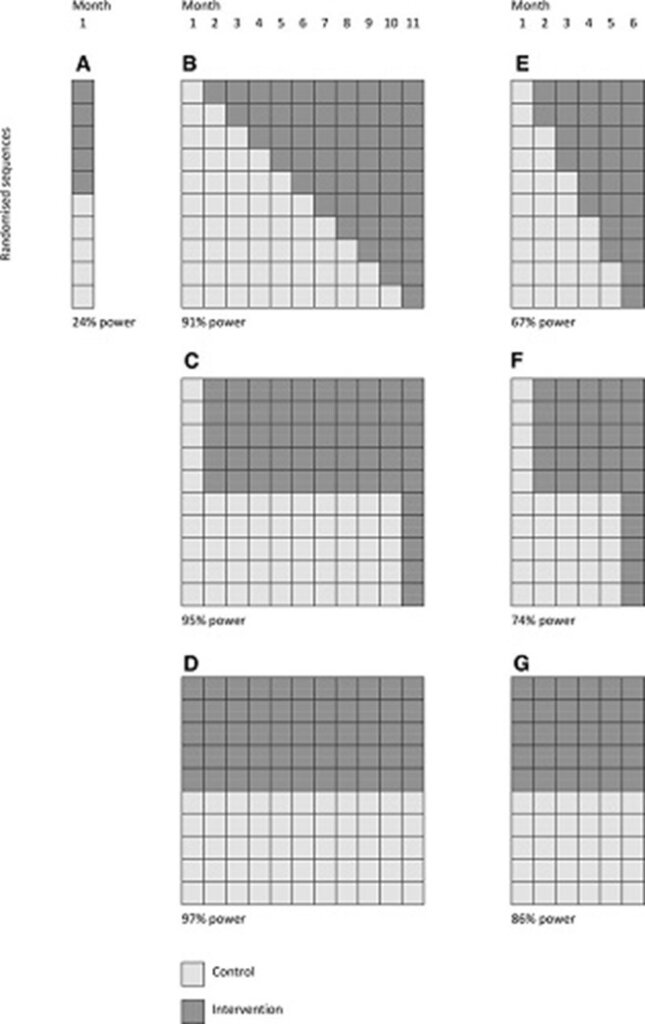
In 2010 I moved institutions again, this time to Queen Mary University (QMUL) of London. I embarked on a long association with the Pragmatic Clinical Trials Unit at QMUL, of which I went on to become a Director, and a more friendly, welcoming and diverse group of colleagues I could not have hoped to find. I also developed my own programme of research on methods for clinical trials. I had three, original, first-author papers published in the BMJ (British Medical Journal) – something of which I am very proud. I also became interested in the rapidly expanding field of “stepped wedge” trials, which have become a byword for evaluating the roll-out of health service interventions and quality improvement programmes. To the right is a Figure from a tutorial article on stepped wedge trials that I wrote for the Journal of Clinical Epidemiology (spot the patterns).
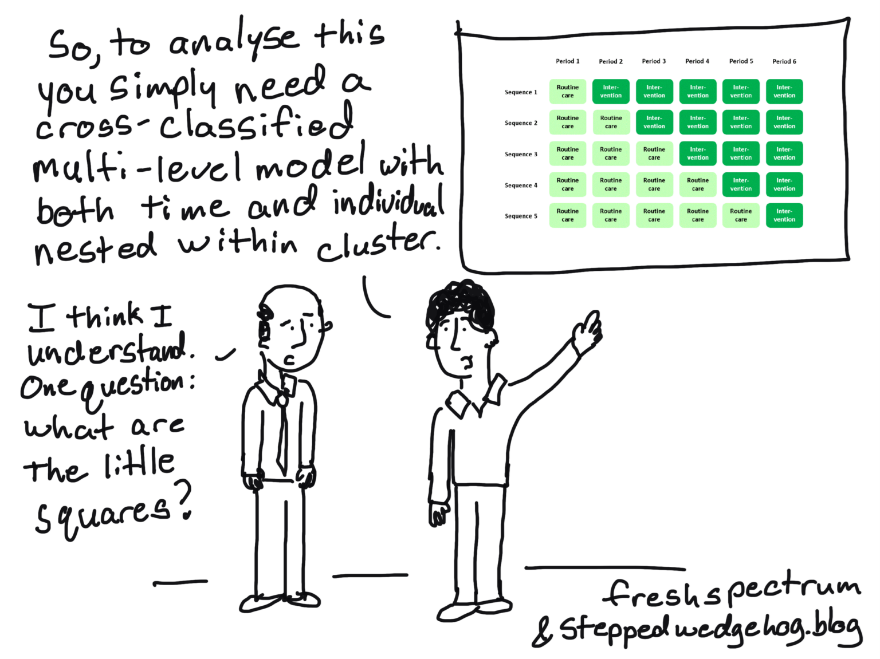
I set up a website called Stepped Wedgehog, and populated it with cartoons that I co-developed with American cartoonist and evaluation expert, Chris Lysy.
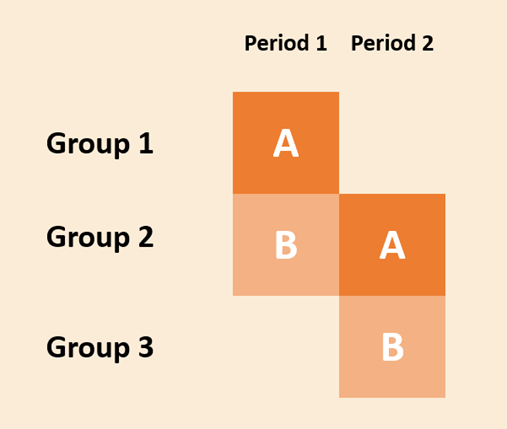
I also worked on the idea of a particularly distilled form of stepped wedge, which I and co-developer Liam Bourke called the “dog-leg” design. On reflection, our “dog-leg” is reminiscent of two Design Council double diamonds rotated by forty-five degrees.
With Alan Girling at Birmingham, I have just submitted a journal article containing a mathematical proof that in some circumstances the dog-leg design minimises the total number of cluster visits that you need to make in a two-period, longitudinal, cluster-randomised trial. Does this matter? Well, the EAGLE trial of a quality improvement intervention in hospitals to reduce complications following colon surgery, which used a dog-leg design, achieved an unprecedented scale of engagement in an evaluation with hospitals around the world, and did so (we calculated) in a much more efficient way than a more traditional approach.
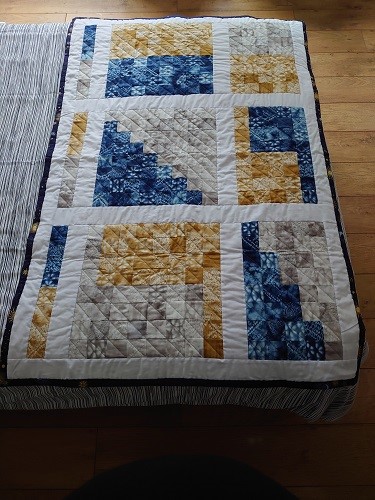
Sometimes when I work on methodological ideas it does feel like I am just making patterns. In fact, my talented colleague, Beth Stuart, now Director of the Pragmatic Clinical Trials Unit, made me a surprisingly decorative patchwork quilt based on a Figure from one of my published articles on stepped wedge trials. But patterns, as I have learned, can be very, very powerful indeed.
The views expressed are those of the author. Posting of the blog does not signify that the Cancer Prevention Group endorses those views or opinions.