In this post Hilary Robbins, Scientist at the International Agency for Research on Cancer (IARC), discuses the art of communicating scientific information accurately.
Whether or not to engage with the mainstream media is a topic often debated among researchers. There is a risk that scientific information will be presented incorrectly, partially, or in a misleading way, so it often feels safest to simply avoid being involved.
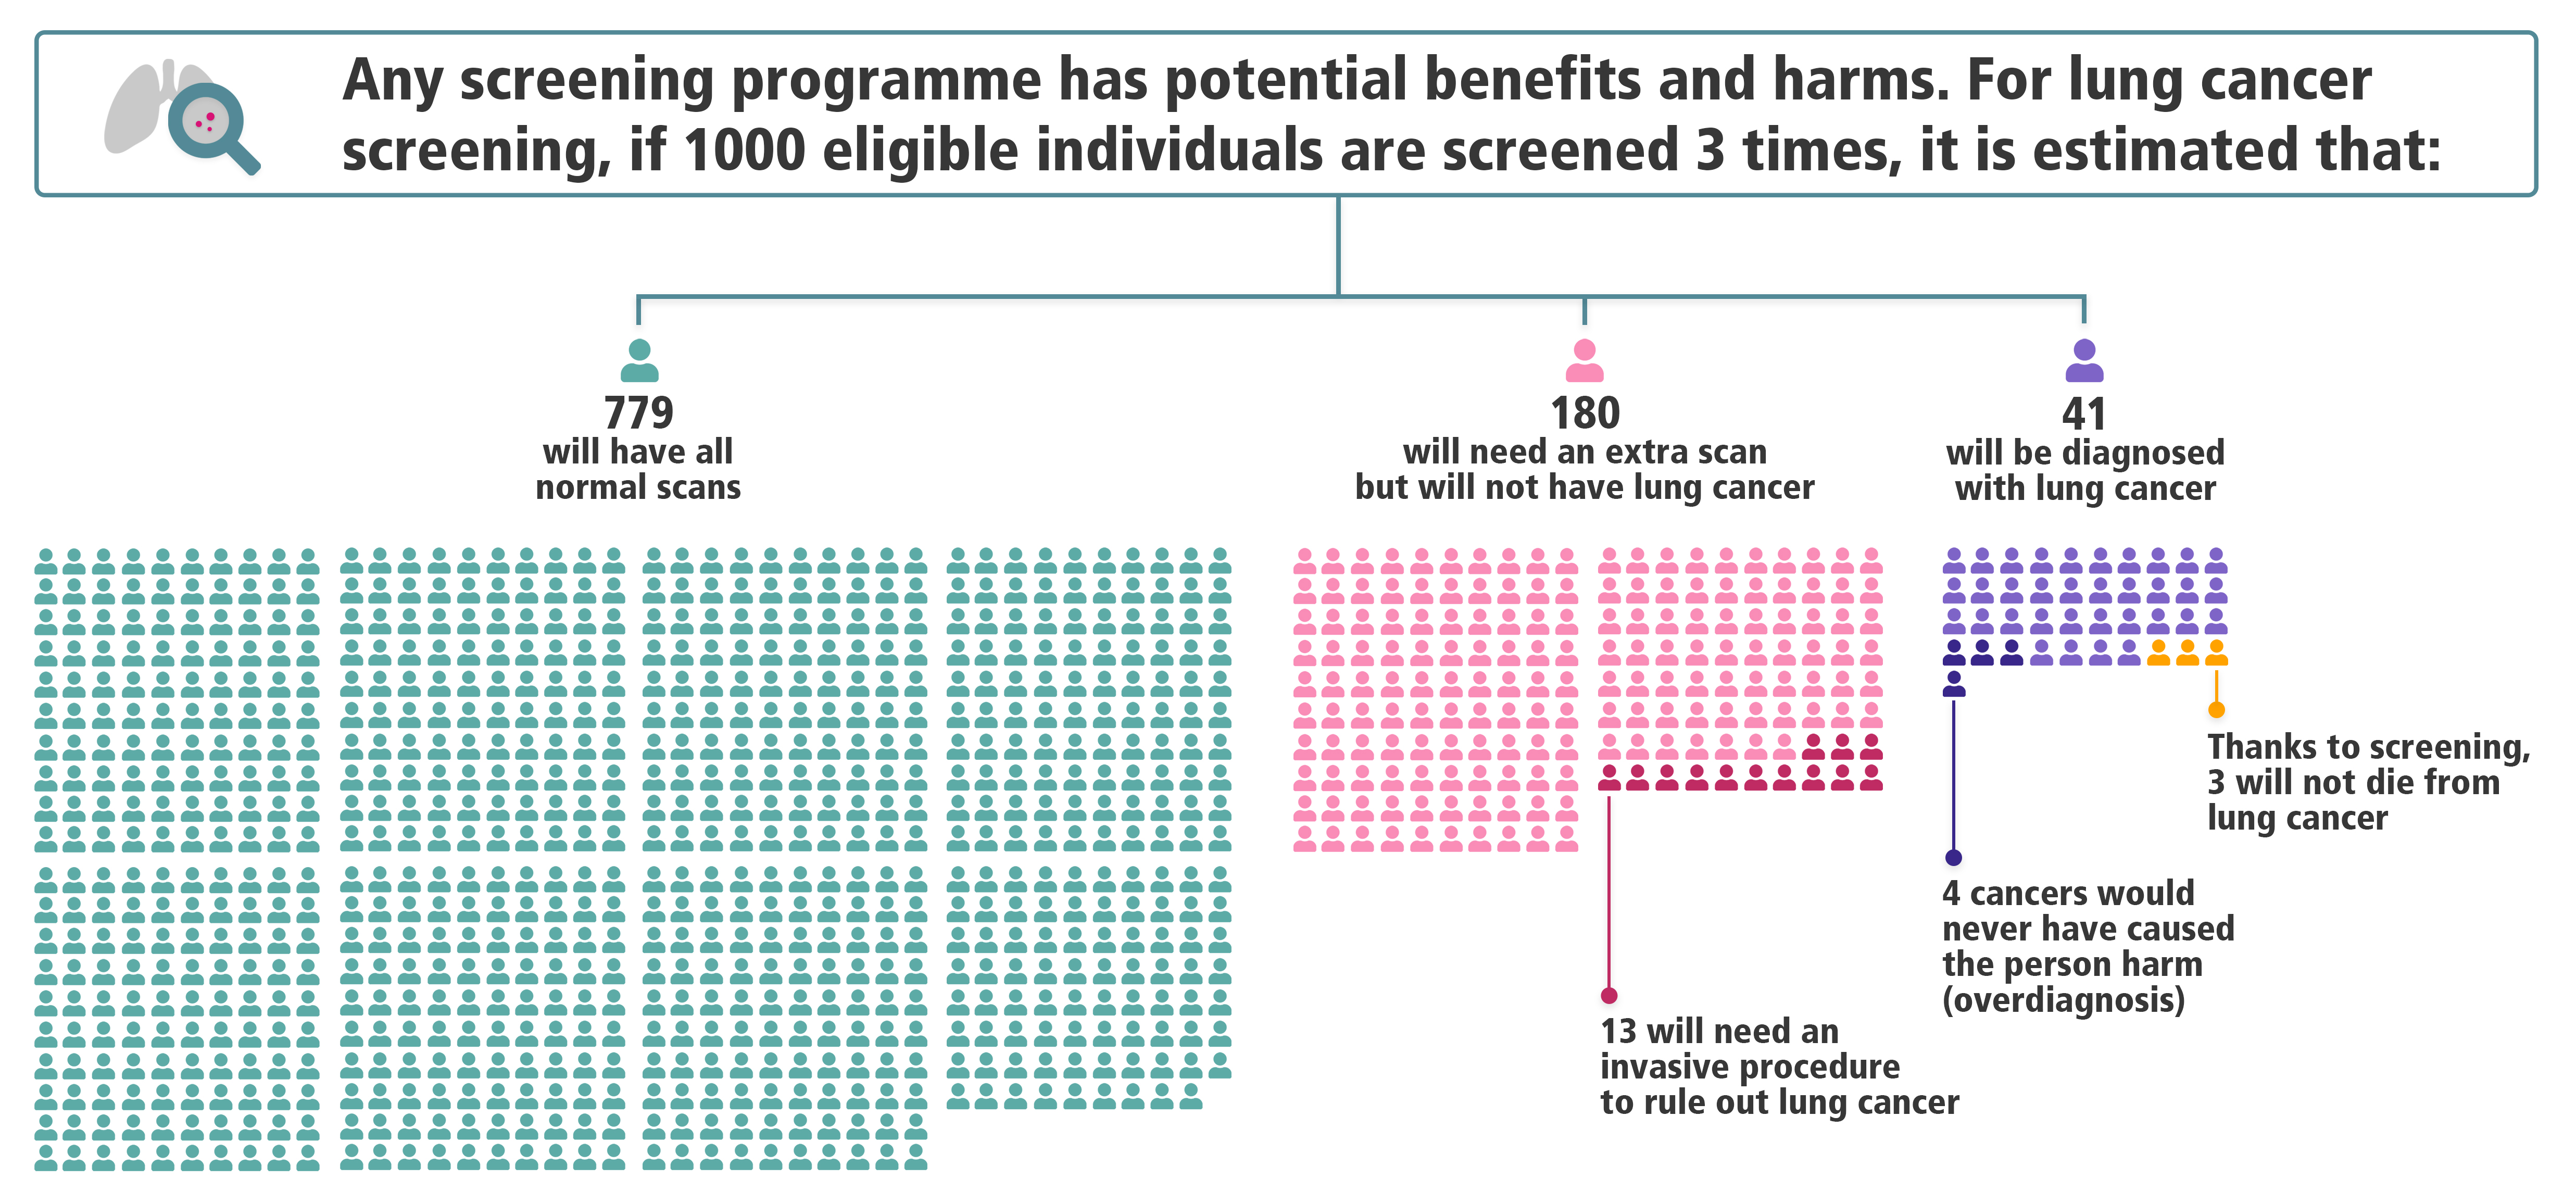
Lung cancer screening provides a topical example of this. A recent BBC Newsnight show claimed that among 1000 long-term smokers screened for lung cancer, one will die as a result of screening. This is not supported by scientific data, so why did they make this claim? The show cited an infographic based on the USA National Lung Screening Trial (NLST, 2002‑2009), which randomized participants to 3 annual screens with either low-dose CT or chest X-ray. In the trial, 0.6 people per 1000 in the NLST CT arm died within 60 days of an invasive procedure (such as bronchoscopy) following a positive screening result. The infographic stated that one person out of 1000, depicted as being cancer-free, “will die from invasive follow-up testing.” In fact, two-thirds of the deaths in question occurred in people with lung cancer, so the risk of death after an invasive procedure in a cancer-free person was very low. Further, cause of death was not considered, so it cannot be assumed that “invasive follow-up testing” was the cause.
The Newsnight show also highlighted the high rate of false-positive screens, but changes in lung screening protocols have reduced these since the NLST. Over 3 screens, the number of people with one or more false-positives has been approximately halved, so it is misleading to imply that the formerly high rate is applicable to people undergoing screening today.
To help bring clarity to the public discussion, I gathered a team of clinicians, epidemiologists, health psychologists, and biostatisticians to produce a new infographic. I have experience analyzing the NLST data, and the screen results had already been classified to reflect new protocols (Lung-RADS v1.0). We agreed on appropriate calculations to reflect what would have happened if Lung-RADS had been used to manage CT scan results in the NLST. The infographic was released by the International Agency for Research on Cancer, highlighted in a Spotlight article by Lancet Respiratory Medicine, and adapted for an article in The Economist.

The infographic and accompanying articles generated new discussions, especially on social media. Clinicians and researchers working in lung screening pointed to the large reduction in false-positives owing to the application of new protocols. Both proponents and opponents of lung cancer screening posted the infographic and used it to support various arguments about the balance and benefits and harms. The debate persisted, but it now centered on accurate information.
Still, there are caveats. Because our infographic summarizes benefits and harms for the average NLST participant, one could argue that it applies precisely to no one. The numbers of people who experience any given harm or benefit depend on the person’s risk at baseline, largely determined by their age and how much they have smoked. Higher-risk people will have more harms (extra scans, invasive procedures, overdiagnosis) – but also a better chance of having their life saved by screening.
Adhering to the design constraints of the NLST is also problematic, for a few reasons. First, benefits and harms strongly depend on the number of screens done and the length of follow-up for lung cancer outcomes. Second, the amount of overdiagnosis – i.e., diagnosis of cancers that would not otherwise have caused harm – is estimated at 18.5% of screen-detected cancers in the NLST, but other trial estimates range widely. Perhaps most importantly, new data, such as from the NELSON and MILD trials, suggest that the NLST may have substantially underestimated the lung cancer mortality reduction from screening.
Despite all this, I think it is important to communicate the most correct version of your data in the simplest way you can. Researchers are inclined – or even trained – to present their findings only if accompanied by a long list of caveats. Engaging in research communication can be unpredictable, and there is no opportunity to list “strengths and limitations” (unless you write a blog post afterwards). But by working to shepherd our science into the arena of public discourse, we can help the conversation begin with the facts.
The views expressed are those of the author. Posting of the blog does not signify that the Cancer Prevention Group endorse those views or opinions.
Share this page


Great blog post which clears up a lot of questions I had – thanks!